Knowledge Graph vs. Colrows Semantic Layer at a Glance
| Feature | Knowledge Graph | Colrows Semantic Layer |
|---|---|---|
| Primary Use Case | Relationship mapping | Deterministic metric definition |
| Data Logic | Stored as entities / nodes | Resolved into SQL at compile time |
| SQL Generation | Indirect / Heuristic | Direct / Governed Compiler |
| Maintenance | High (ontology heavy) | Low (schema driven, autonomous) |
| Best For | Search and discovery | Enterprise AI agents and analytics |
The architecture gap: ontologies drift, compilers do not
Both architectures encode "meaning," but they fail in opposite ways. Picking the wrong foundation for AI is the difference between an agent that can describe how your business is related and an agent that can compute what is true about it.
The Knowledge Graph trap
Building an ontology is expensive and culturally hard. Conceptual graphs are usually authored by a small team of domain experts, then drift from the underlying database reality as schemas evolve, joins get redefined, and new metrics are introduced. The graph becomes a parallel source of truth that needs its own maintenance backlog, with no compile-time guarantee that the SQL an agent emits actually matches what the graph asserts.
The semantic compiler fix
Colrows uses the semantic layer as a compiler: it ingests your warehouse schema, your dbt models, your catalog metadata, and your usage signals to build a typed graph autonomously, and then resolves every agent question through it into executable, auditable SQL. There is no separate ontology to keep in sync with the database, and there is no heuristic LLM step between intent and execution. The structure that closes the accuracy gap is the structure that ships your queries.
Knowledge graphs map "what" is related. The Colrows semantic layer defines "how" to calculate the metric and "who" is authorized to see it. Fix the context, not the model.
Short answer
A semantic layer and a knowledge graph both deal with meaning, but they are designed for different jobs. A semantic layer makes business data usable, governed, and consistent across analytics, applications, and AI agents - it produces governed SQL, metric APIs, and trusted analytical answers. A knowledge graph connects concepts, entities, facts, and relationships across a broader knowledge space - it produces connected context, entity relationships, and reasoning paths.
A semantic layer helps enterprises answer business questions consistently. A knowledge graph helps enterprises understand how things are connected. The first is execution-oriented; the second is context-oriented. For production AI, the question is rarely which one - it is which one is the more urgent pain to solve first.
The confusion is reasonable. Both use relationships and meaning. But their outputs are fundamentally different. Semantic layers compile to deterministic SQL with versioned definitions. Knowledge graphs produce nodes, edges, and inference paths. The benchmarks make the architectural distinction visible.
What is a semantic layer?
A semantic layer sits between enterprise data sources and the systems that consume data. It translates business language into approved data logic. It defines what terms such as revenue, active customer, churn, portfolio risk, collection efficiency, claim ratio, or gross margin mean inside the organization - and crucially, it compiles that meaning into governed SQL before any query touches the warehouse.
A semantic layer typically includes:
- Business entities such as Customer, Account, Product, Loan, Order, Claim, or Region
- Approved metrics and formulas with versioned definitions
- Dimensions, filters, fiscal calendars, and aggregation logic
- Trusted relationships and proven join paths between tables
- Governance policies such as RBAC, ABAC, masking, and row-level rules
- Versioning and auditability for definitions and generated queries
The decisive property is operational consistency. When different teams or tools ask for the same business metric, they use the same approved logic. dbt Labs’ April 2026 benchmark on the ACME Insurance dataset found that for questions within a well-modeled semantic layer’s scope, GPT-5.3 Codex reached 100% accuracy and Claude Sonnet 4.6 reached 98.2%, versus 84.1% and 90.0% respectively for text-to-SQL. The decisive point: the semantic layer tells you it cannot answer rather than returning a plausible wrong number.
As dbt’s benchmark puts it: “With text-to-SQL, failure looks like a plausible but incorrect answer. With the Semantic Layer, failure looks like an error message. For anything going to a board deck, an auditor, or a company KPI dashboard, that difference is everything.”
It does not only describe business meaning. It uses that meaning to generate trusted queries, enforce governance, and produce consistent answers. The LLM’s job is reduced to picking the right metric and dimensions; the compiler generates the SQL deterministically - so the same intent always produces the same SQL, and an out-of-scope question fails rather than fabricating. This is exactly the distinction covered in semantic layer vs. semantic execution layer: a layer that only defines meaning versus one that compiles and governs it before execution.
What is a knowledge graph?
A knowledge graph represents information as connected entities and relationships. Instead of organizing knowledge only as documents, tables, or folders, it connects facts into a graph: customers are linked to accounts, accounts are linked to products, products are linked to policies, policies are linked to risks, and risks are linked to controls. It can include structured data, unstructured documents, business concepts, people, systems, processes, policies, events, and external references.
A knowledge graph typically includes:
- Entities such as people, organizations, assets, products, locations, documents, systems, or policies
- Relationships such as owns, belongs to, depends on, reports to, caused by, derived from, or governed by
- Attributes and facts associated with each entity
- Ontologies or schemas that define types of entities and relationships
- Reasoning paths that help systems infer connections or explain context
Knowledge graphs shine on multi-hop reasoning and relationship discovery. The data.world benchmark (Sequeda, Allemang & Jacob, arXiv:2311.07509, November 2023) found GPT-4 zero-shot on raw SQL scored 16.7% accuracy across 43 enterprise business questions, rising to 54.2% when given a knowledge-graph representation - a 3x lift, +37.5 percentage-point improvement. Microsoft Research’s GraphRAG showed 72% comprehensiveness and 62% diversity win rates over vector RAG on narrative summarization questions, while using over 97% fewer context tokens at the root-level summary tier.
It helps enterprises connect scattered knowledge so users and AI systems can explore relationships, dependencies, and meaning across domains. Its strength is in resolving which entities and relationships a question touches, not in calculating the deterministic value of a governed metric.
The honest division of labor: graphs win reasoning, lose aggregation
Industry analysis converges on the same conclusion: these solve different problems. A semantic layer standardizes what data means; a knowledge graph captures how data relates. The data.world benchmark made the asymmetry concrete: on the two hardest quadrants (high schema complexity, metric and strategic-planning questions executives actually ask), raw SQL scored exactly 0% while the knowledge graph reached 35.7% and 38.7%. Connected context wins on reasoning.
But the reverse asymmetry is just as real. For deterministic metric calculation - “what was Q3 EU revenue, net of refunds, on a fiscal calendar” - graphs struggle.
CypherBench (Feng, Papicchio & Rahman, arXiv:2412.18702, December 2024) tested 11 multi-domain property graphs covering 7.8M entities and over 10,000 questions. The best LLM, Claude 3.5 Sonnet, reached only 61.58% execution accuracy on text-to-Cypher. Sub-10B-parameter models scored under 20%. The paper is explicit on why:
RDF does not enforce type constraints and standardized units on values. As a result, literal values in Wikidata often appear with different units (e.g., centimeters and feet for heights) and sometimes incorrect types, which leads to incorrect results when computing aggregation over these values.
The same paper notes RDF graphs suffer from overly large schemas, resource-identifier overhead, and overlapping relation types. Academic work on aggregate queries over knowledge graphs (arXiv:2203.03792) notes that computing aggregates over graph matches is “computationally expensive” and prone to quality errors. Even Neo4j’s own documentation concedes that “a limitation of vector indexes is that they can’t aggregate information like you can with a structured query language like Cypher.”
The synthesis: graphs are excellent for resolving which entities and relationships a question touches, but the deterministic calculation of a governed metric belongs in compiled SQL against the warehouse. That is the semantic-execution-layer thesis.
Key differences at a glance
| Aspect | Semantic layer | Knowledge graph |
|---|---|---|
| Primary purpose | Convert business intent into consistent, governed data answers. | Connect entities, facts, documents, and relationships into shared context. |
| Main question answered | How should this business question be answered from data? | How are these concepts, entities, and facts connected? |
| Primary output | Governed SQL, metric API, semantic query plan, trusted analytical result. | Entity graph, relationship path, contextual answer, inferred connection. |
| Common users | BI teams, analysts, data consumers, applications, AI agents. | Search systems, knowledge teams, data scientists, AI systems, domain experts. |
| Core strength | Metric consistency, governed analytics, deterministic execution. | Context discovery, relationship exploration, reasoning over connected information. |
| Governance role | Applies access and policy rules at compile time, before SQL touches data. | Represents policy relationships, ownership, lineage, and context. |
| Typical data shape | Structured analytical data mapped to business concepts. | Structured and unstructured knowledge represented as nodes and edges. |
| Aggregation guarantees | Deterministic by design; same intent produces identical SQL and result. | Constrained by unit non-normalization; aggregation correctness is hard to prove. |
| Risk if missing | Dashboards and agents produce inconsistent or unsafe answers. | Teams and AI systems lose cross-domain context and relationship awareness. |
Enterprise example: customer risk analysis
A financial services team wants to understand customer risk. The question sounds simple: “Which high-value customers are showing increased repayment risk?”
A semantic layer answers the analytical part. It defines high-value customer, repayment risk, overdue exposure, collection status, collateral value, region, and account ownership, plus the approved formulas the business has signed off on. It decides which tables to query and which access rules to apply before SQL is emitted. The same question asked twice returns the same number, with a reproducible audit trail.
A knowledge graph expands the context around the customer. It connects the customer to related companies, directors, guarantors, collateral documents, legal cases, prior restructurings, call-center notes, field-visit records, industry exposure, and policy exceptions. It explains why a customer may be connected to broader risk signals beyond the immediate metric.
Both are useful - but they answer different parts of the problem:
- The semantic layer calculates the trusted risk indicators.
- The knowledge graph explains the surrounding relationships and context.
- The semantic layer controls the governed query path and policy enforcement.
- The knowledge graph reveals why the customer may sit inside broader risk patterns.
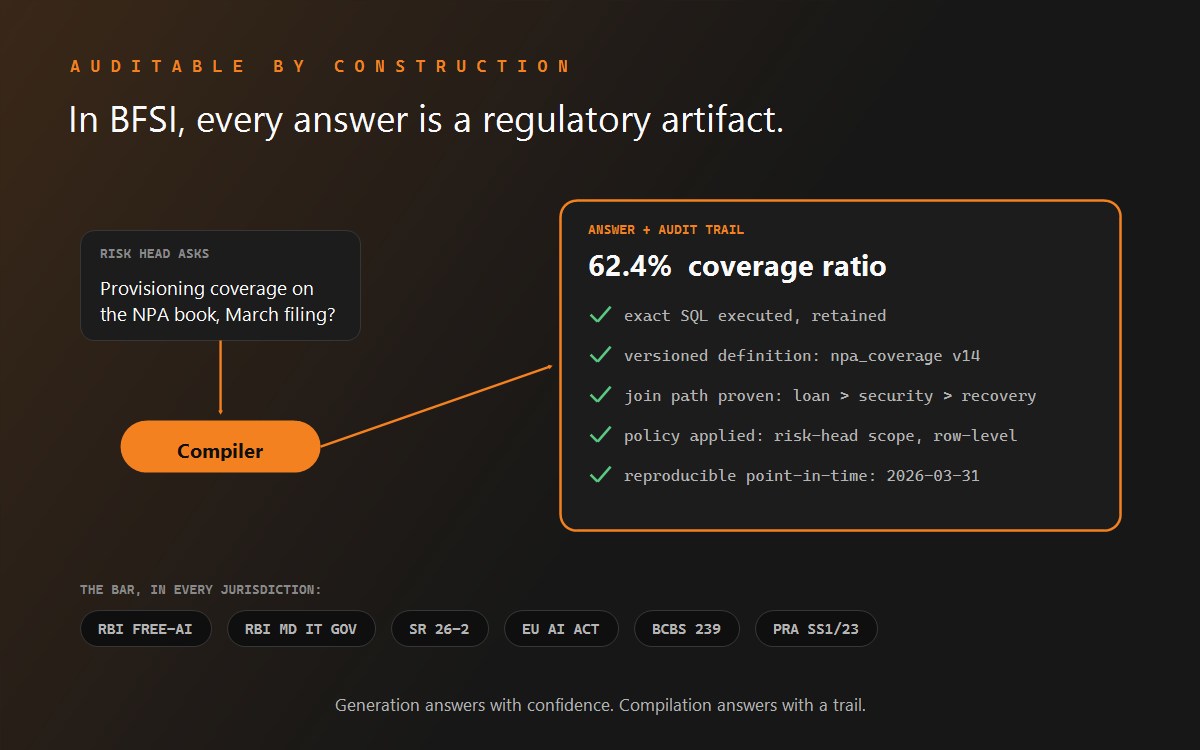
A semantic layer tells the enterprise which answer is valid. A knowledge graph helps explain what else is connected to that answer. For regulated workflows like BFSI risk and recovery, you usually need both - but the metric itself must compile through the semantic layer.
Which one do you need?
The right choice depends on the business problem you are solving first. Most enterprises eventually need both - but the priority depends on where the immediate pain sits.
| Your problem | Better starting point |
|---|---|
| Dashboards show different numbers for revenue, churn, risk, or margin. | Semantic layer |
| AI agents generate SQL that is valid but not business-correct. | Semantic layer |
| Users need governed access to structured enterprise data. | Semantic layer |
| You need reusable metrics across BI, applications, and AI agents. | Semantic layer |
| Regulator demands point-in-time reproducibility of a number. | Semantic layer |
| You need to connect documents, entities, people, systems, and policies. | Knowledge graph |
| You need relationship discovery across domains. | Knowledge graph |
| You need explainable context for complex investigative decisions. | Knowledge graph |
| You are building an enterprise AI platform over structured AND unstructured knowledge. | Both, layered |
| Autonomous agents must act on governed numbers with full audit trails. | Both, with semantic execution at the front |
How semantic layers and knowledge graphs work together
The most powerful architecture is not semantic layer versus knowledge graph. It is semantic layer plus knowledge graph, with each one handling a different responsibility. Promethium’s research across 522 enterprise queries found agents with unified, multi-dimensional context achieved 38% higher accuracy than agents using semantic definitions alone.
A practical layered workflow:
- The knowledge graph connects enterprise context. It links entities, documents, policies, systems, people, events, and relationships. It helps AI systems understand the wider context around a business question - typically by surfacing which entities and relationships are relevant.
- The semantic layer defines trusted analytical meaning. It defines approved metrics, entities, dimensions, relationships, and governance rules for structured data. It ensures business questions resolve to consistent SQL with a versioned definition behind every number.
- The AI system uses both. When an agent receives a question, it uses the knowledge graph to expand context and understand which entities the question touches, and the semantic layer to produce governed, auditable answers from enterprise data.
- The enterprise gets both explanation and execution. The knowledge graph improves reasoning and discovery. The semantic layer improves accuracy, governance, consistency, and audit. Together, they make AI systems more useful and more controllable.
This combination matters most for industries where decisions depend on both structured metrics and connected context - banking, insurance, healthcare, manufacturing, telecom, and asset recovery. The metric must be defensible; the context must be discoverable.
Why AI changes the decision
Before AI agents, semantic layers (Looker, MicroStrategy, SAP BusinessObjects) were deterministic at the front end - a human picked “Revenue” from a dropdown. AI agents are stochastic. They generate free-text intent, hallucinate joins, and invent column names at machine speed. The governance question shifted from “did the human pick correctly?” to “did the agent compile through a governed substrate?”
A knowledge graph can tell an agent that a customer is linked to a company, a company is linked to a director, and the director is linked to another high-risk entity. That is reasoning. But when the agent needs to calculate exposure, revenue, recovery rate, or claim ratio, it needs a semantic layer to ensure the answer is calculated correctly. That is execution.
The realities of enterprise text-to-SQL make the case for semantic execution sharper. The “Text-to-SQL for Enterprise Data Analytics” paper (arXiv:2507.14372) notes Spider 2.0’s best model hit only 31% execution accuracy in April 2025 on realistic enterprise schemas (ground-truth queries over 100 lines long on tables with over 1,000 columns). Uber reported only 50% table-overlap on its internal evaluation set. State-of-the-art on the easier Spider benchmark reached ~86% by late 2023, but production enterprise data does not look like Spider.
Knowledge graphs are strong at context. Semantic layers are strong at trusted execution. Without a semantic layer, an AI agent may understand relationships but calculate the wrong metric. Without a knowledge graph, the agent may calculate the metric correctly but miss important surrounding context. Production AI for regulated workloads needs both.
Competitive positioning: where governed logic lives
The semantic-layer category is being rebuilt for AI agents. Every serious vendor has taken a position. The distinction between them is not whether to ground in a semantic model - all of them do - but where the governed logic lives and how deterministic the SQL generation is.
Palantir Foundry (Ontology / knowledge-graph approach)
Foundry’s Ontology is an operational “digital twin” combining semantic elements (objects, properties, links) and kinetic elements (actions, functions). The most opinionated end of the spectrum: typed object + link + action + function primitives as a single governed surface coupled to an application layer. Third-party analysis from Timbr.ai notes the trade-off: it is a closed, service-intensive architecture with “total cost of ownership reaching into millions annually for large enterprises.” Strength: operational decision-making and write-back. Weaker fit: lightweight, warehouse-native metric-governance for BI.
dbt Semantic Layer (metrics-as-code in the transformation layer)
Powered by MetricFlow (acquired with Transform in early 2023, now Apache 2.0-licensed), dbt defines metrics in version-controlled YAML alongside transformations and compiles SQL on the fly for Snowflake, BigQuery, Databricks, and Redshift. Strength: metrics-as-code, auditability, single source of truth in the transformation layer; now supports the Open Semantic Interchange (OSI) format. Limitation: it is a hand-authored metric API above transformations, not an autonomously maintained semantic graph above the warehouse with compile-time RBAC/ABAC for agents.
ThoughtSpot (analytics / search-driven BI)
Spotter Semantics (launched March 13, 2026) uses “patented search tokens” and ThoughtSpot Modeling Language to produce deterministic SQL. SVP François Lopitaux: “this deterministic approach relies on our patented search tokens, not text-to-SQL powered by LLMs, which is why we can guarantee the most consistent, trustworthy insights on the market.” A governed Metrics Catalog prevents metric drift; usage grew 133% YoY by end of fiscal 2025. Best fit: human-in-the-loop consumption. Caveat (per TechInformed): launch “does not show independent benchmarks comparing answer consistency, accuracy or cost against alternative text-to-SQL approaches.”
AtScale (universal semantic layer / OLAP heritage)
Universal semantic layer with autonomous aggregate generation and MDX/DAX/SQL/REST/Python interfaces. Strong for Fortune 500 estates with OLAP/Excel heritage; integrates with Databricks Genie, Snowflake Cortex, and an MCP server. A North American home-improvement retailer (2,200+ stores) case study reports 80% of queries completing under 1 second on a 20+ TB semantic cube. Best fit: OLAP-shaped semantics for BI dashboards.
Colrows (deterministic semantic compiler / semantic execution layer)
Differentiators: a typed, versioned, multi-scope semantic graph built and maintained autonomously; compile-time governance (RBAC/ABAC and row/column predicates injected before SQL touches the warehouse); join-path proof (the planner must prove a path through the graph before SQL emits); point-in-time reproducibility via per-query audit records; dialect-perfect SQL across 16+ engines; agent-native via REST, JDBC, and MCP. Best fit: autonomous agents that must compile to governed SQL with a defensible audit trail.
Industry use cases where semantic layers prove superior for metric consistency
Banking and BFSI
BCBS 239 (“Principles for Effective Risk Data Aggregation and Risk Reporting,” issued January 2013 in response to the 2008 crisis) requires banks to maintain “consistent risk definitions,” standardized formats, and auditable aggregation under stress, across 14 principles. The BIS’ November 2023 progress report stated banks are at different stages and that “additional work is required at all banks to attain or sustain full compliance.” Inconsistent data definitions across departments are the primary compliance obstacle - exactly the metric-drift problem a deterministic semantic layer solves with version-controlled, auditable definitions and compile-time governance. See our deeper treatment in auditable SQL for regulated industries.
Insurance
The data.world enterprise benchmark used an insurance-domain schema precisely because reporting-to-metrics questions are schema-intensive. GPT-4 on raw SQL scored 0% on the hardest high-schema metric questions without semantic grounding. EU AI Act Annex III explicitly classifies AI for “risk assessment and pricing in life and health insurance” as high-risk, requiring automatic event logging over the system lifetime - a requirement compile-time semantic governance satisfies by design.
Healthcare
Semantic interoperability (SNOMED CT, LOINC, RxNorm, HL7 FHIR) ensures the same clinical data yields the same conclusion across systems. Per Firely’s 2025 survey, regulations advising or mandating FHIR reached 73% across surveyed countries. The stakes are high: the Institute of Medicine’s To Err Is Human estimated between 44,000 and 98,000 patients die each year in U.S. hospitals due to medical errors. Consistent, governed definitions are the foundation for trustworthy clinical analytics. See conversational analytics for clinical data.
Manufacturing
OEE (availability × performance × quality) is, per Gartner’s Simon Jacobson, notoriously “miscalculated, misinterpreted and - as a result - often misused” when definitions differ across plants and systems (ERP, MES, SCADA, IoT). AtScale and Databricks both position a semantic layer as the way to standardize OEE and supply-chain KPIs across fragmented sources for consistent, traceable reporting.
Recommendations: a staged decision framework
Stage 1: Diagnose your failure mode (now)
If your AI/BI pain is relationship discovery (“how are these entities connected, what is the root cause?”), invest in a knowledge graph or GraphRAG. If your pain is metric inconsistency (“five reports, five revenue numbers” or agents returning subtly wrong KPIs), prioritize a deterministic semantic execution layer. Most enterprises have both pains and should plan a layered architecture rather than choosing one.
Stage 2: Pilot with a benchmark you control (1-2 quarters)
Reproduce the dbt open-source semantic-layer-vs-text-to-SQL benchmark on a slice of your own data and schema. Threshold to advance: covered-question accuracy ≥ 95% with a deterministic layer and a clean “cannot answer” signal on out-of-scope questions. If text-to-SQL alone already exceeds ~90% on your covered questions and wrong answers are low-stakes, a lighter-weight approach may suffice.
Stage 3: Enforce governance at compile time for regulated/agent workloads
For BFSI, insurance, healthcare, and any autonomous-agent deployment, require: (a) RBAC/ABAC and row/column predicates injected into generated SQL before execution (not post-filtering), (b) per-query audit records with point-in-time reproducibility, and (c) proven join paths. These are the thresholds that satisfy BCBS 239-class auditability and prevent silent data leakage.
Stage 4: Decide build-location by consumer
Keep BI semantics where humans consume (Looker, ThoughtSpot, AtScale for dashboards and search). Add an agent-native semantic execution layer (Colrows-class) where autonomous agents generate intent and must compile to governed SQL. Use Palantir-style ontology where you need operational write-back and action orchestration, not just analytics. dbt MetricFlow is the sensible default when metrics-as-code in the transformation layer covers your needs and your consumers are primarily BI tools.
What would change this recommendation: if text-to-SQL execution accuracy on realistic enterprise schemas (currently ~31-65%) rises durably above ~95% with reliable self-correction and refusal behavior, the determinism premium shrinks. Track the dbt and Spider 2.0 leaderboards as your trigger.
How Colrows approaches this distinction
Colrows is a semantic execution layer for enterprise AI. It is designed to turn business intent into governed, traceable answers across data systems. It connects business meaning, metrics, relationships, and governance so AI agents and analytics tools can use enterprise data safely.
The architecture takes graph-style thinking seriously - enterprise meaning is naturally connected: customers relate to accounts, accounts relate to transactions, transactions relate to products, products relate to regions, and policies apply across those relationships. A strong semantic layer must understand those connections. But its purpose is execution: producing trusted answers that compile through versioned definitions and proven join paths.
This is the practical distinction. A generic knowledge graph describes the enterprise. Colrows is built to help the enterprise ask governed questions and receive reliable, auditable answers. For an autonomous agent compiling intent through Colrows, the same question asked twice produces the same SQL and the same result, every time - because the compiler is deterministic and the graph is versioned. For more depth, see the enterprise memory graph and the semantic control plane.
Colrows builds the Autonomous Semantic Layer for enterprise AI.
Fix the Context. Not the Model.
Start the conversation: engage@colrows.com · colrows.com
Frequently asked questions
Is a semantic layer the same as a knowledge graph?
No. A semantic layer standardizes what data means and compiles to governed SQL. A knowledge graph models how entities relate and supports multi-hop reasoning. Most enterprises need both. Promethium’s research across 522 enterprise queries found agents with unified, multi-dimensional context achieved 38% higher accuracy than agents using semantic definitions alone.
Why can text-to-SQL alone not solve enterprise analytics?
Models have improved (text-to-SQL roughly doubled to 64.5% on the dbt set between 2023 and 2026), but they still return plausible wrong answers on complex schemas. Spider 2.0’s best model hit only 31% execution accuracy on realistic enterprise schemas in April 2025. A deterministic semantic layer refuses out-of-scope questions rather than fabricating. dbt’s April 2026 benchmark found GPT-5.3 Codex at 100% and Claude Sonnet 4.6 at 98.2% accuracy on semantic-layer queries versus 84.1% and 90.0% on text-to-SQL.
Are knowledge graphs bad at metrics?
They are structurally weak at deterministic aggregation. RDF unit non-normalization (heights stored in centimeters and feet in the same graph, for example) leads to incorrect aggregation results, as CypherBench documents. CypherBench finds the best LLM, Claude 3.5 Sonnet, reaches only 61.58% execution accuracy on text-to-Cypher, and even Cypher itself struggles with aggregate-equivalence proofs.
How does compile-time governance differ from runtime security?
Compile-time governance injects RBAC, ABAC, and row/column predicates into the SQL before execution, so filtered rows are never read and unauthorized intent fails to compile. Runtime security applies filters after data is accessed, which means an incomplete result can be presented as complete and audit trails capture what ran but not what should have run.
Where does Colrows fit against dbt, ThoughtSpot, AtScale, and Palantir?
dbt MetricFlow governs metrics-as-code in the transformation layer. ThoughtSpot governs at the search/BI layer with patented search tokens. AtScale provides OLAP-shaped universal semantic layer for Fortune 500 estates. Palantir Foundry’s Ontology is an operational digital twin with write-back actions. Colrows targets agent-native compile-time execution above the warehouse with an autonomously maintained semantic graph, dialect-perfect SQL across 16+ engines, and MCP/JDBC interfaces for autonomous agents.
Does a semantic layer slow query performance?
A compile-then-execute layer adds milliseconds at compile time and can improve runtime by emitting dialect-optimized SQL. Runtime query-proxy designs are the ones that add overhead. AtScale’s home-improvement retailer case study reports 80% of queries completing in under one second on a 20+ TB semantic cube.
Which industries benefit most from semantic layers?
Regulated and metric-intensive sectors: banking (BCBS 239 risk-data aggregation), insurance (high-schema metric questions where raw SQL scored 0%), healthcare (FHIR, SNOMED CT semantic interoperability), and manufacturing (OEE standardization across plants). Each domain requires consistent, auditable definitions that deterministic compilation provides by design.
Closing thought
Semantic layers and knowledge graphs are both part of the enterprise meaning stack, but they serve different purposes. The semantic layer makes data answers consistent, governed, and executable - and the dbt 2026 benchmark shows that for covered enterprise questions, this means 98-100% accuracy with a clean refusal signal on the rest. The knowledge graph makes enterprise context connected, searchable, and explainable - and the data.world benchmark shows this means 3x lift on relationship-heavy questions where SQL alone scores zero.
For analytics and AI teams, the decision should not start with architecture labels. It should start with the business problem. If the problem is inconsistent answers, unsafe AI queries, and duplicated metric logic, you need a semantic execution layer. If the problem is scattered context and hidden relationships, you need a knowledge graph. If the goal is production-grade enterprise AI that calculates and reasons - and most enterprise AI is - you will need both, with deterministic compilation in front of the structured-data path.
Read next: The Company Brain Advantage - why the semantic layer is the deterministic heart of any production-grade Company Brain, and the architecture pattern enterprises are converging on for AI-native operations.