
Cost of doing nothing vs the semantic-layer investment
Start the CFO conversation with one table. It puts the do-nothing path next to the invest path in words a finance leader reads first. Dollar figures come later, inside the model. This table shapes the argument.
| Pain | Cost of doing nothing | Semantic-layer investment |
|---|---|---|
| Analyst backlog | High monthly burn on ad hoc report requests | One canonical metric, self-serve for business users |
| Hallucination incidents | Recurring exec-visible failures on AI answers | Compile-time refusal when the join path is not proved |
| Repeated dashboard rebuilds | Every team codes the same metric from scratch | One definition, versioned, reused by every consumer |
| Audit rework | Regulator asks how a number was computed. Nobody knows. | Point-in-time reproducible audit trail per query |
| Decision latency | Weeks to answer questions the data already contains | Answers in seconds, from the graph the CDO governs |
The left column is a monthly bill the finance team already pays. It is spread across headcount, cloud spend, and lost revenue. The right column is the plan to stop paying it. The rest of this guide fills in the numbers.
Three deployments, one pattern
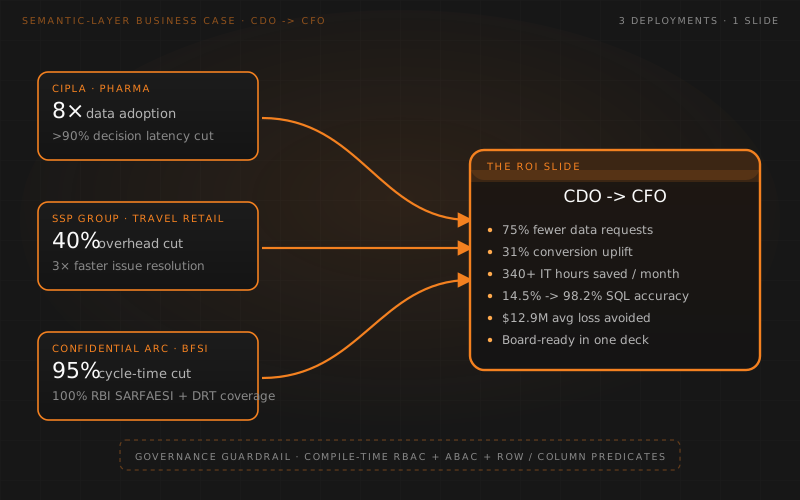
Three enterprise deployments in three different sectors show the same outcome shape. Each capsule below carries the real figures. Each links to the case study.
Cipla (Pharma)
Cipla is one of India's largest pharmaceutical companies. Its data team ran a semantic-layer programme against a wide SAP and CRM estate. The board-visible numbers came in the first year.
Read the full Cipla case study. The stockout number alone carries the business case in retail-facing pharma.
SSP Group (Travel retail)
SSP Group runs food and beverage outlets across airports and rail hubs. Its data programme had to serve a distributed operations team. The programme cut data-management drag and lifted collaboration.
Read the full SSP Group case study. The 40% overhead cut is the line that translates to headcount capacity for new work.
A confidential asset reconstruction company (BFSI)
A regulated non-performing-asset reconstruction firm applied a semantic-layer programme to its evaluation pipeline. Regulatory coverage was the non-negotiable. Cycle time was the win.
Read the full BFSI case study. The regulator conversation is a different conversation when every query carries a compile-time audit trail.
Three sectors. Three deployment shapes. One pattern. Adoption goes up, latency and overhead go down, and governance holds. The finance model works from there.
The aggregate math
Beyond individual case studies, aggregate figures across semantic-layer programmes settle the ROI question. The four numbers below are the ones a CFO can put in a slide.
Each figure maps to a P&L line. Fewer data requests to IT frees engineers to build. Higher sales conversions land in revenue. Recovered IT hours convert to capacity or headcount reduction. The Gartner figure is the risk column. It is the cost the CDO is asking the CFO to stop paying.
Colrows also publishes a first-party text-to-SQL benchmark. Accuracy moved from 14.5% on a raw LLM to 98.2% with the semantic-execution-layer pipeline in place. MRR@1 sat at 0.91. Read the method and full results in the text-to-sql benchmark. Accuracy at that level is what turns an AI project from experiment to production.
The CFO conversation in six questions
The CFO will ask six questions. Answer each in one paragraph. Keep the numbers close.
What are we buying?
A runtime that compiles business intent into governed, deterministic SQL across 16+ engines. The pipeline is intent, context resolution, constrained planning, governed execution. It replaces hand-authored metric YAML and post-query filters with one canonical definition and compile-time governance. For the plain-English category definition, see semantic layer vs semantic execution layer.
What breaks if we do not?
Analyst backlog stays high. AI agents keep hallucinating on structured data. Audit rework repeats every quarter. The Gartner figure of $12.9M in average annual loss from poor data quality is the ceiling on the do-nothing bill. Read the deep dive on deterministic vs probabilistic text-to-SQL for the failure modes in plain language.
Where do we save?
Four places. IT hours saved (340+ per month in the aggregate). Decision latency cut (Cipla saw more than 90%). Overhead reduction (SSP saw 40%). Revenue lift (Cipla's 18-24% sales productivity and 30% stockout drop). Each of these maps to a line item the CFO already tracks.
What is the payback?
Payback is driven by recovered analyst hours and avoided rework. In deployments like Cipla, IT report requests fell 80% in year one. A finance model that credits only the recovered hours and the audit rework saved typically shows payback inside 12 months for a mid-sized enterprise. Faster if the programme also cuts a hallucination incident that hit the exec team last quarter.
What is the risk of buying?
The main risk is picking a semantic layer that stops at one warehouse. Read the semantic layer buyer's guide 2026 for the five evaluation criteria that predict production survival. Portability standards are maturing, so the CDO should ask each vendor how their interoperability signals evolve. Contract terms should include exit clauses and export of metric definitions.
Why not build it?
Building a semantic execution layer means writing a compiler, a graph store, a governance planner, and dialect adapters for every warehouse in the estate. It is a two-year project before the first business user sees value. Read the full trade-off in build vs buy semantic layer. For most enterprises, buy is the answer. Build is only defensible when the estate is genuinely novel.
The one-slide board case
Paste these lines into the deck. They are ordered so the story reads top to bottom.
- The problem is analyst backlog, hallucination on AI, and audit rework across the data estate.
- The fix is one canonical metric definition served to every consumer, with compile-time governance.
- Cipla shows the pattern: 8x data adoption, 80% fewer IT report requests, 30% fewer stockouts.
- SSP Group shows the pattern in operations: 40% overhead cut, 3x faster issue resolution.
- A confidential BFSI reference shows the regulator pattern: more than 95% cycle-time cut, 100% regulatory coverage.
- Aggregate: 340+ IT hours saved per month, 31% higher sales conversions, 75% fewer data requests.
- Payback inside 12 months. Risk clause on the buy is exit terms and interoperability signals.
Seven lines. One slide. The rest of the deck is the finance model and the reference calls.
The governance argument
Finance leaders care about governance because it maps to audit and risk. A semantic layer that treats governance as a policy YAML separate from the metric definition will not survive a regulator conversation. Compile-time governance means RBAC, ABAC, and row-level or column-level predicates are injected before any SQL leaves the planner. Read the deep dive on governance-as-code vs governance-as-semantics.
The mechanism matters. Ask the vendor to show a query that a user is not authorised to run. A semantic execution layer refuses at compile time and returns a proof of refusal. A weaker layer runs the query and filters rows on the way out. The second option leaks metadata and fails audit. For the compiler behind this behaviour, read what is a semantic compiler.
Fix the Context, Not the Model. A well-governed semantic layer that understands business context creates more reliable AI-driven analytics than fine-tuning the model itself.
Frequently asked questions
Is a semantic layer worth the cost?
Yes, when your AI or BI programme queries data at scale. Three referenceable deployments show the pattern. Cipla lifted data adoption 8x and cut IT report requests 80%. SSP Group cut data-management overhead 40%. A confidential asset reconstruction company cut its evaluation cycle time by more than 95%. The investment pays back through analyst hours saved, faster decisions, and audit-ready governance. If your programme is only a few dashboards for a small team, direct BI is enough.
What is the ROI of a semantic layer?
ROI comes from four buckets. Analyst hours saved (Cipla saw an 80% drop in IT report requests; the concept-note aggregate shows 340+ IT hours saved per month). Faster decisions (Cipla cut decision latency by more than 90% and diagnosed campaigns 1000x faster). Revenue lift (Cipla lifted sales productivity 18 to 24% and cut stockouts 30%; the aggregate shows 31% higher sales conversions). Risk avoided (Gartner-cited $12.9M average annual loss per enterprise from poor data quality).
How do I write a business case for a semantic layer?
Frame it as two columns. Left column: the cost of doing nothing (analyst backlog, hallucination incidents, repeated dashboard rebuilds, audit rework, decision latency). Right column: the semantic-layer investment (compile-time governance, one canonical definition per metric, autonomous graph, audit trail). Attach three references with real numbers (Cipla, SSP, the confidential ARC). Close with a payback line and a risk clause.
How long is the payback period?
Payback is driven by analyst-hour recovery and decision latency. In deployments like Cipla, IT report requests dropped 80% and decision latency fell more than 90% within the first year. The concept-note aggregate shows 340+ IT hours saved per month and 75% fewer data requests. A finance model that credits only the recovered hours and the avoided rework typically shows payback inside 12 months for a mid-sized enterprise.
Do I need a semantic layer if I already have BI?
Yes, if AI agents or other applications query the same data. BI tools carry metric definitions inside the dashboard. AI agents, notebooks, and downstream apps do not read those definitions. A semantic layer holds one canonical definition per metric and serves every consumer. It is the layer that stops your revenue number from meaning three different things in three different tools.
What is the cost of not having a semantic layer?
The cost stacks in five places. Analyst backlog (IT teams service ad hoc report requests instead of building new products). Hallucination incidents (AI agents return wrong numbers with confident tone). Repeated dashboard rebuilds (each team codes the same metric from scratch). Audit rework (regulators cannot verify how a number was computed). Decision latency (executives wait weeks for answers the data already contains). Gartner cites $12.9M as the average annual loss per enterprise from poor data quality.
Next step
See the deployment references, and book a technical review. Walk through the Cipla, SSP, and BFSI numbers with the team that built them. Then run the finance model against your own estate. Contact the Colrows team to schedule the review, or compare the semantic-execution-layer approach against every other platform on the comparisons hub.